LESSON: Interpreting Scatter Plots
Outliers
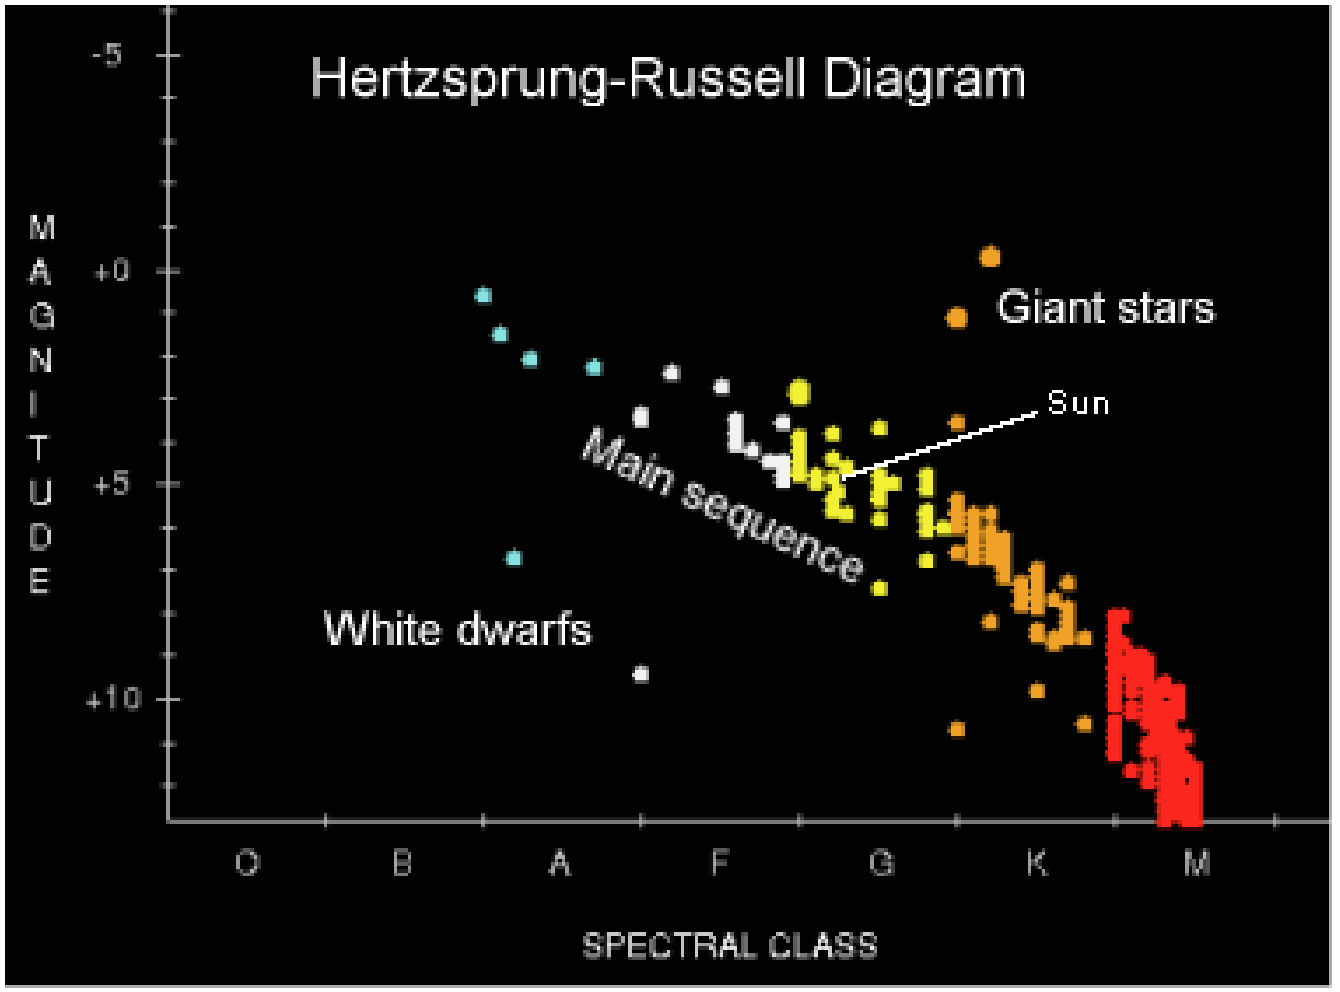
An outlier is a data point that is significantly far away from the majority of the data. There is no precise mathematical definition for what makes a data point an outlier. It’s usually somewhat obvious. For example, notice that White Dwarf Stars and Giant Stars are both outliers in the below scatter plot showing a star’s spectral class (temperature) versus its magnitude (brightness).

Why do we care about outliers? We
care because outliers often throw off the
analysis of the data set. For example, let’s say
you have three test grades in math class: 80%,
80%, and 80%. Your current class average is, you guessed it, 80%. However, if we throw in an outlier, like a 0%, for
the next test, your class average drops down to 60%. You have dropped two letter grades from a B- to a D-. Yikes!
The outlier sure hurt your grade.