LESSON: Interpreting Scatter Plots
Linearity
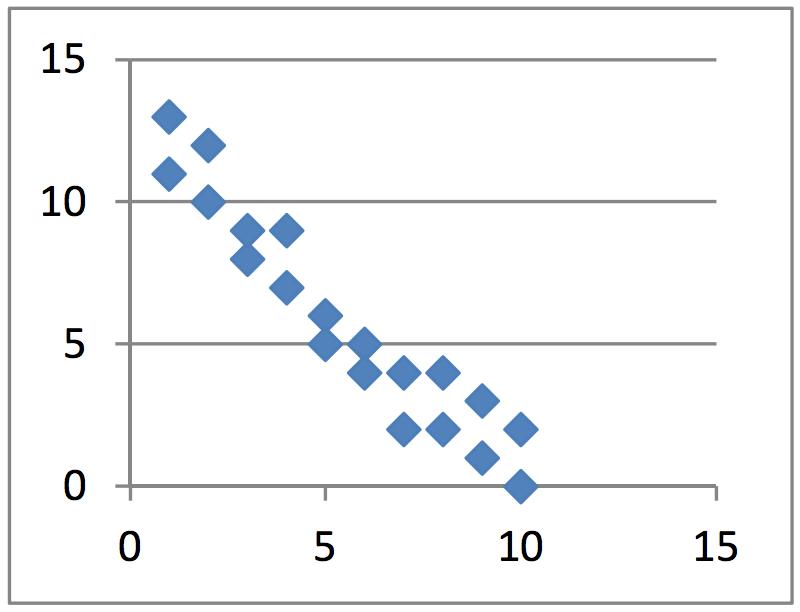
Whether the association is positive or negative, it may appear linear or non-linear. A linear association would be a scatter plot where the data points clump together around what appears to be a line. The scatter plots shown below are an example of a positive and negative linear association.


A non-linear association is usually curved to some extent.
There are many types of curves that it could fit, but we’ll just
focus on the fact that it doesn’t look a line and therefore is nonlinear.
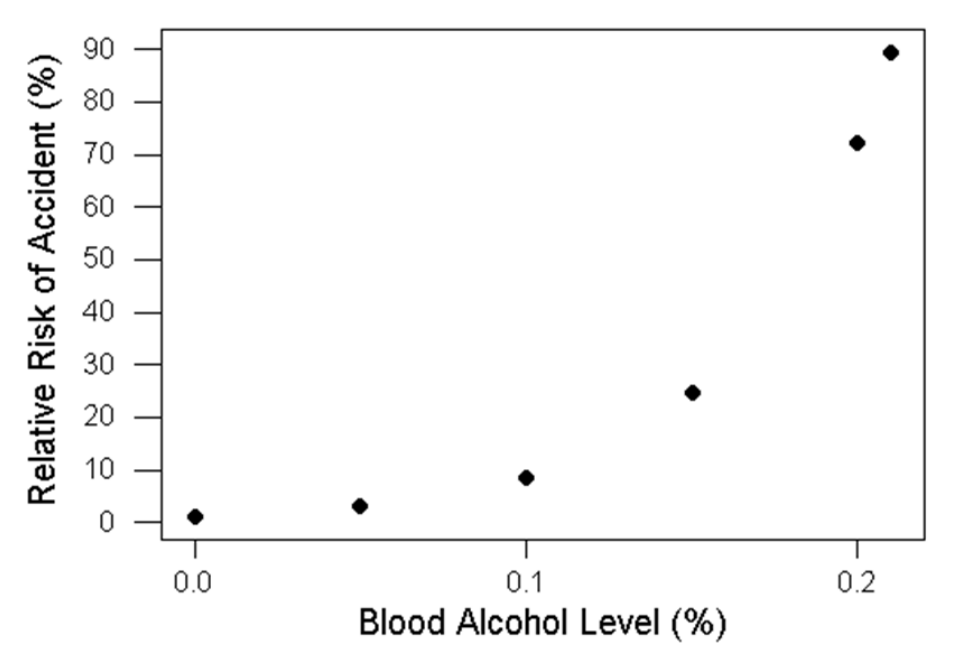
Consider the graph below showing the relative risk
of an accident compared to the blood alcohol level. As you can
see, the graph curves sharply up when there is more alcohol in
the blood stream. This should not only serve as an example of
non-linear scatter plot, but also the risks of drinking and driving.
