LESSON: Interpreting Scatter Plots
Completion requirements
Clustering
Clustering is when there is an
association, but it appears to come in
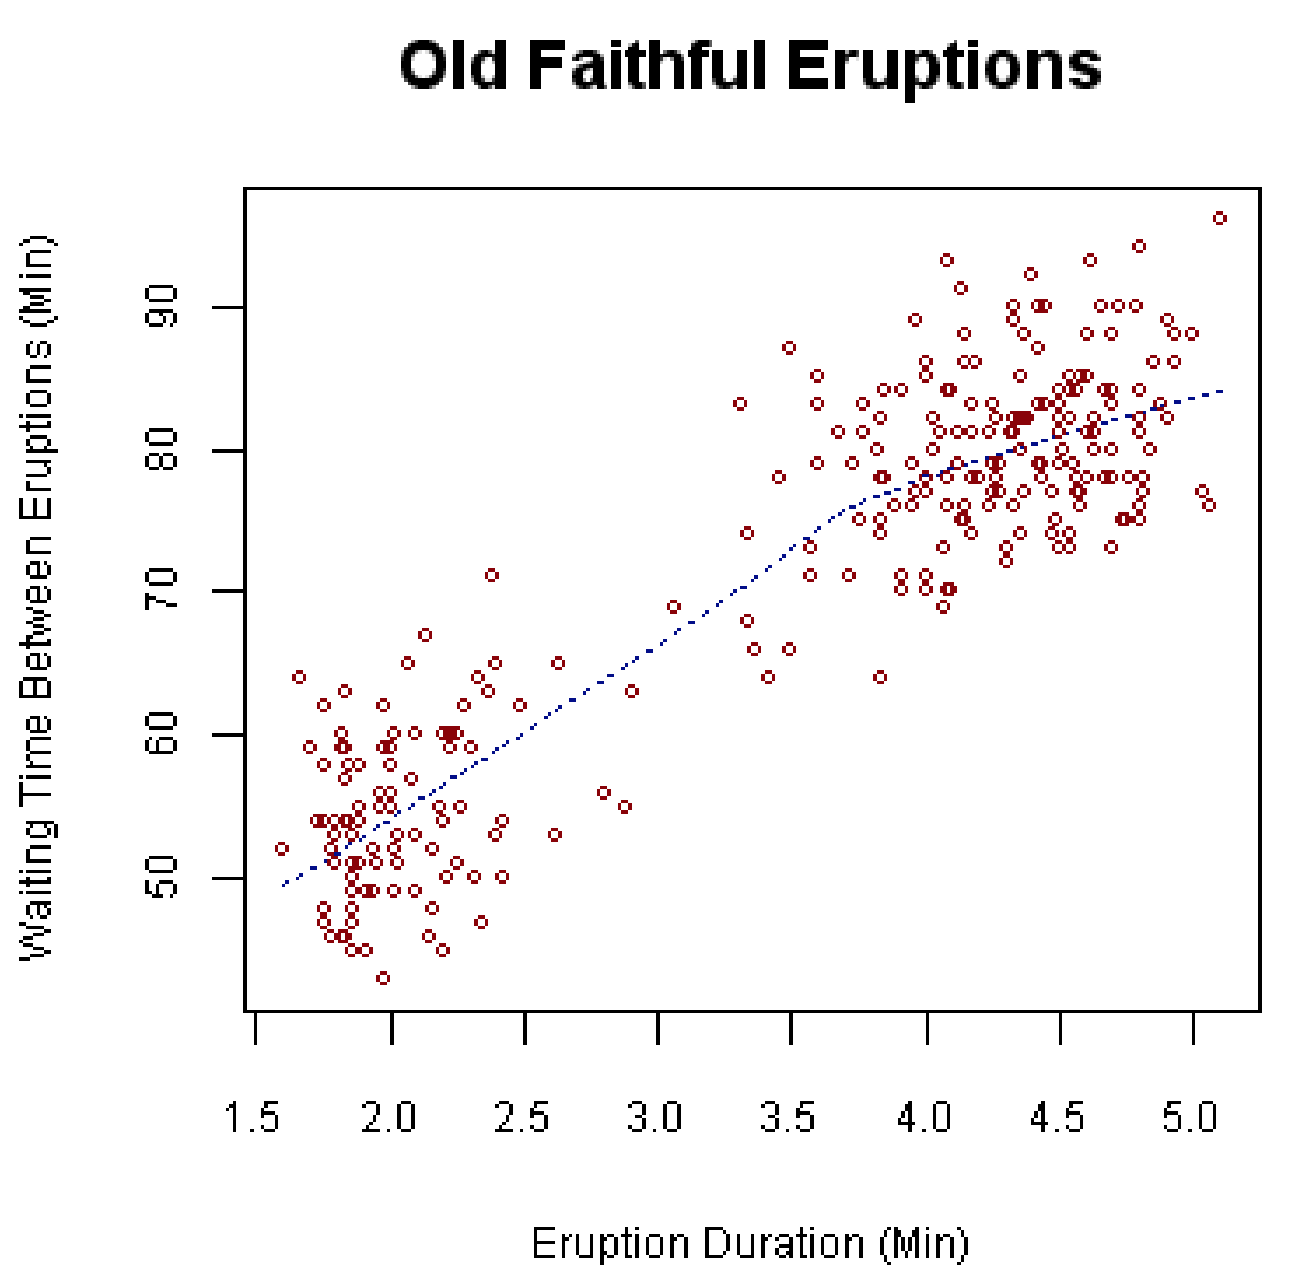
clumps. Consider the following scatter plot
that shows the time between eruptions and
eruption duration of Old Faithful. Notice
how the points cluster towards the lower left
and upper right. While this does show us a
positive association (meaning the longer
between eruptions, the longer the next
eruption will last), it also shows us that there
are not very many medium length eruptions.
They are either short eruptions with short
wait times or long eruptions with long wait
times.
