LESSON: Correlation
Correlation Coefficient
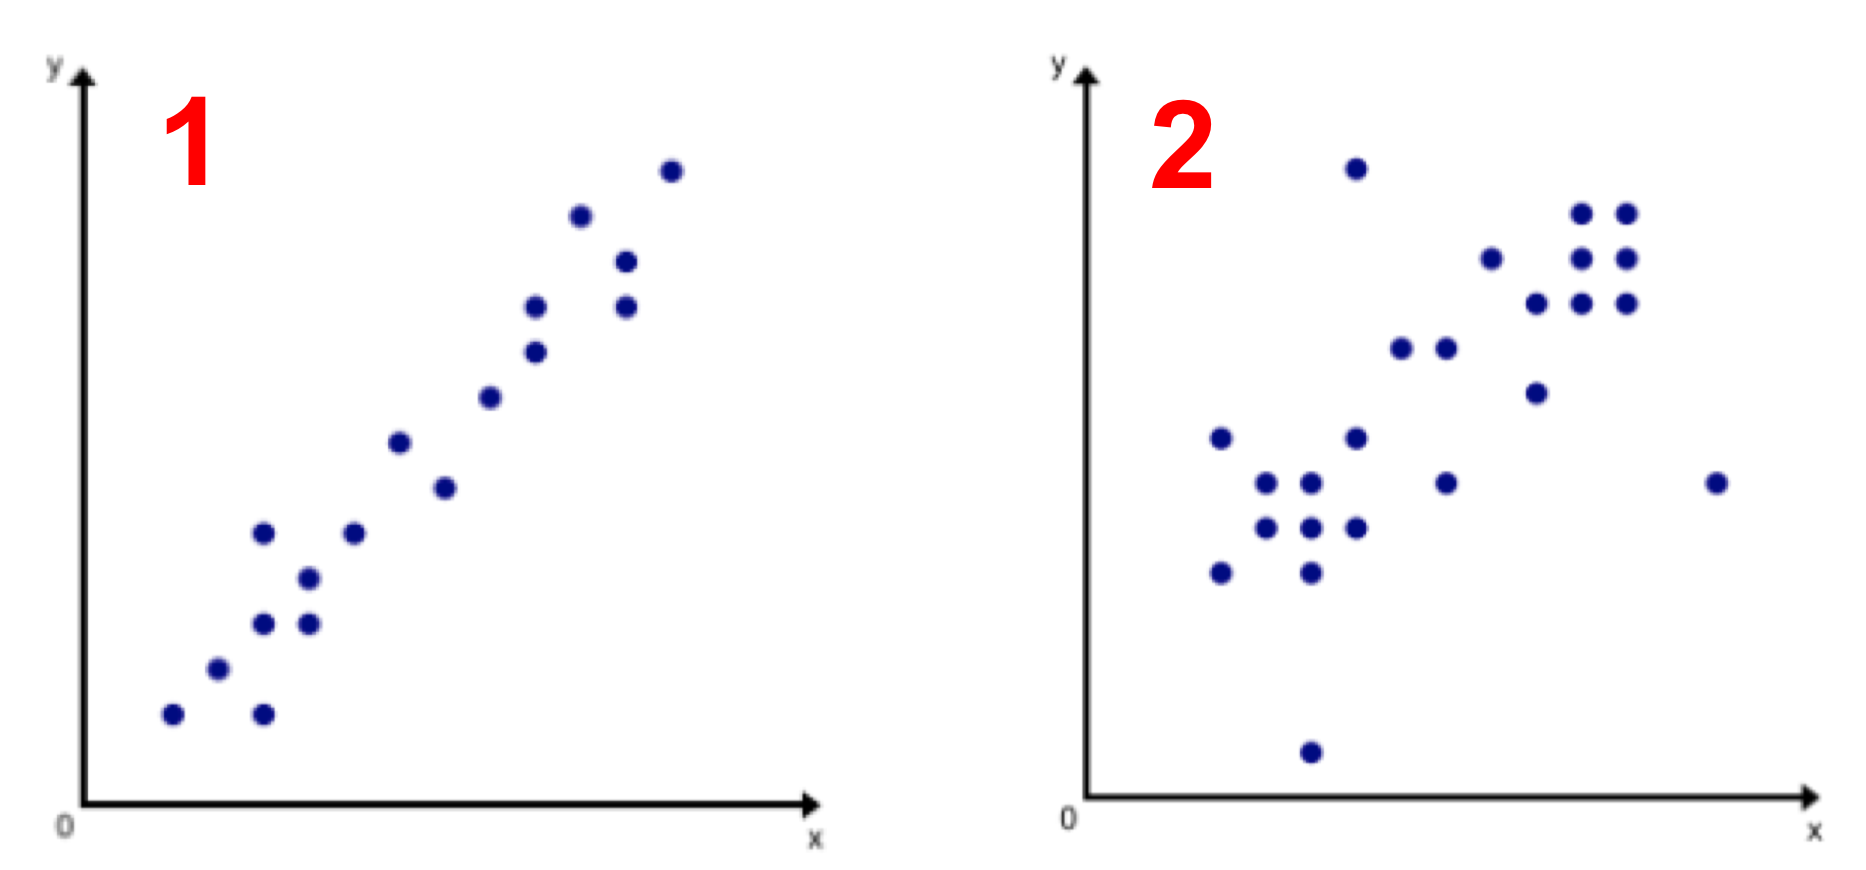
Interpreting correlation by visually assessing a scatter plot can be subjective. Take a look at the two scatter plots shown below. Both scatter plots appear to have a positive linear correlation, but the data in scatter plot 1 seems to have a much stronger positive correlation than the data in scatter plot 2. But how much stronger? How can we quantify the strength of a correlation?

A more precise way to measure the type (positive or negative) and strength of a linear correlation between two variables is to calculate the correlation coefficient. We use the variable r to represent the correlation coefficient.
The range of the correlation coefficient is from -1 to 1. Negative correlations will have negative r values. Positive correlations will have positive r values.
If the two variables have a perfect positive correlation, then the correlation coefficient will be r=1.
If the two variables have a perfect negative correlation, then the correlation coefficient will be r=-1.
If the two variables have absolutely no correlation, then the correlation coefficient will be r=0.
Several examples are shown below:
