LESSON: Measures of Spread
Completion requirements
Measures of Spread
Interquartile Range
The interquartile range is the difference between the Q3 and Q1, and it is abbreviated IQR. Thus, IQR=Q3−Q1. The IQR gives information about how the middle 50% of the data are spread. Fifty percent of the data values are always between Q3 and Q1.
Example: A recent study proclaimed Mobile, Alabama the wettest city in America. (Source: http://www.livescience.com/environment/070518_rainy_cities.html.) The following table lists measurements of the approximate annual rainfall in Mobile over a 10 year period.
Find the range and IQR for this data.
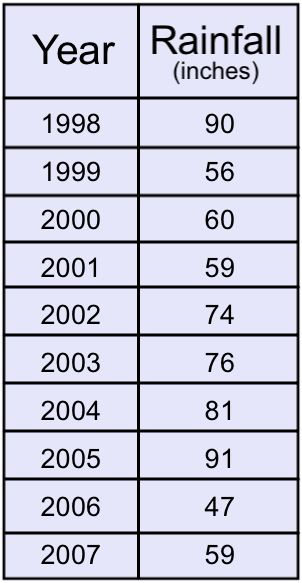
First, place the data in order from smallest to largest.
To find the

The