LESSON: Measures of Spread
Measures of Spread
Variance & Standard Deviation
The standard deviation is an extremely important measure of spread that is based on the mean. Recall that the mean (represented by $${\bar{x}}$$ and pronounced "x bar") is the numerical balancing point of the data. One way to measure how the data are spread is to look at how far away each of the values is from the mean. The difference between a data value and the mean is called the deviation. Written symbolically, it would be as follows:
$$Deviation = x - \bar{x}$$
Let’s take the simple data set of three randomly selected individuals’ shoe sizes shown below:
9.5 11.5 12
The mean of this data set is 11. The deviations are as follows:
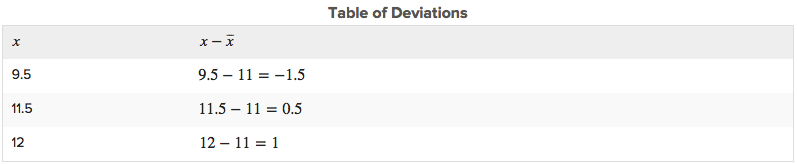
Notice that if a data value is less than the mean, the deviation of that value is negative. Data points that are greater than the mean have positive deviations.
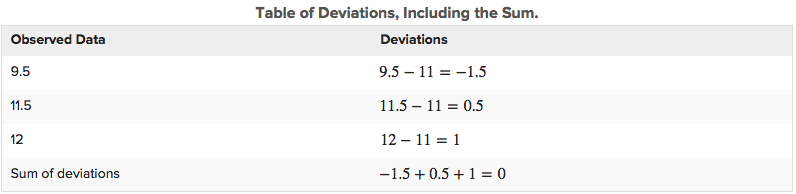
The standard deviation is a measure of the typical, or average, deviation for all of the data points from the mean. However, the very property that makes the mean so special also makes it tricky to calculate a standard deviation. Because the mean is the balancing point of the data, when you add the deviations, they always sum to 0.
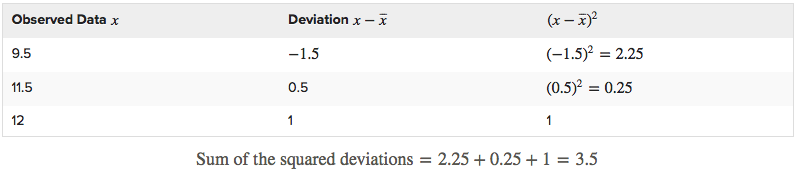
We want to find the average of the squared deviations. To find an average, you usually divide by the number of data points in your set, n. If we were finding the standard deviation for an entire population then we would divide by n. However, in this example, we are only working with a sample of a population, so we will divide by n - 1. Since n = 3, you will divide 3.5 by 2.
The result, which is called the variance, is $$3.5/2=1.75$$. The variance of a sample is denoted by $$s^{2}$$ or the Greek letter $$\sigma^{2}$$ and is a measure of how closely the data are clustered around the mean. Because we squared the deviations before we added them, the units we were working in were also squared.
To return to the original units, we must take the square root of our result: $$\sqrt{1.75}=1.32$$.
This quantity is the standard deviation and is denoted by
A small standard deviation means that the data points are clustered close to the mean, while a large standard deviation means that the data points are spread out from the mean.