LESSON: The Normal Distribution
Completion requirements
Identifying Normally Distributed Data
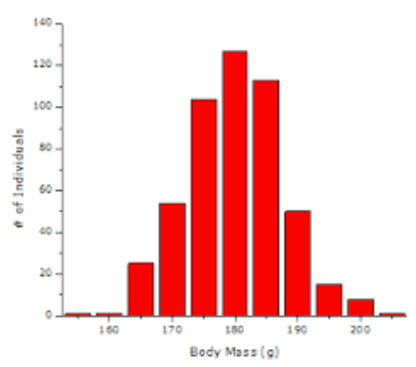
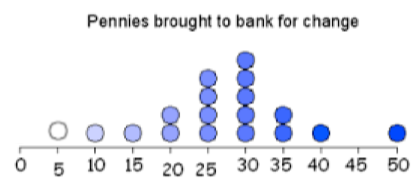
In order to determine if a data set is normally distributed it is best to graph the data on a histogram or a dot plot. If the shape of the data in the graph resembles the "bell" shape curve of a normal distribution, then it is safe to say the data is normally distributed.
Another way to check if data is normally distributed is to find the mean, median and mode of the data. If the mean, median and mode are all approximately equal, then the data is symmetrical; that means that data is normally distributed.
We can see that the two graphs shown below have normal distributions because they both have a "bell" shape and their measures of center are approximately equal.

Mean = 180.1 $$\approx$$ Median = 180 $$\approx$$ Mode = 180

Mean = 27 $$\approx$$ Median = 27.5 $$\approx$$ Mode = 30